The Peer Benchmarking Dashboard
The peer benchmarking panel displays how aspects of your security practices compare to benchmarks for those aspects within your industry and across all other industries. With this information you can do the following:
-
Understand which of your assets may be particularly attractive to hostile actors.
-
Identify areas where simple changes may improve your security metrics and enable compliance with industry best practice.
-
Focus on assets where improvement will make the most difference to your business risk.
| Field No. | Key Metric Name | Key Metric Description |
|---|---|---|
1 |
Percentage of Assets with Vulnerabilities |
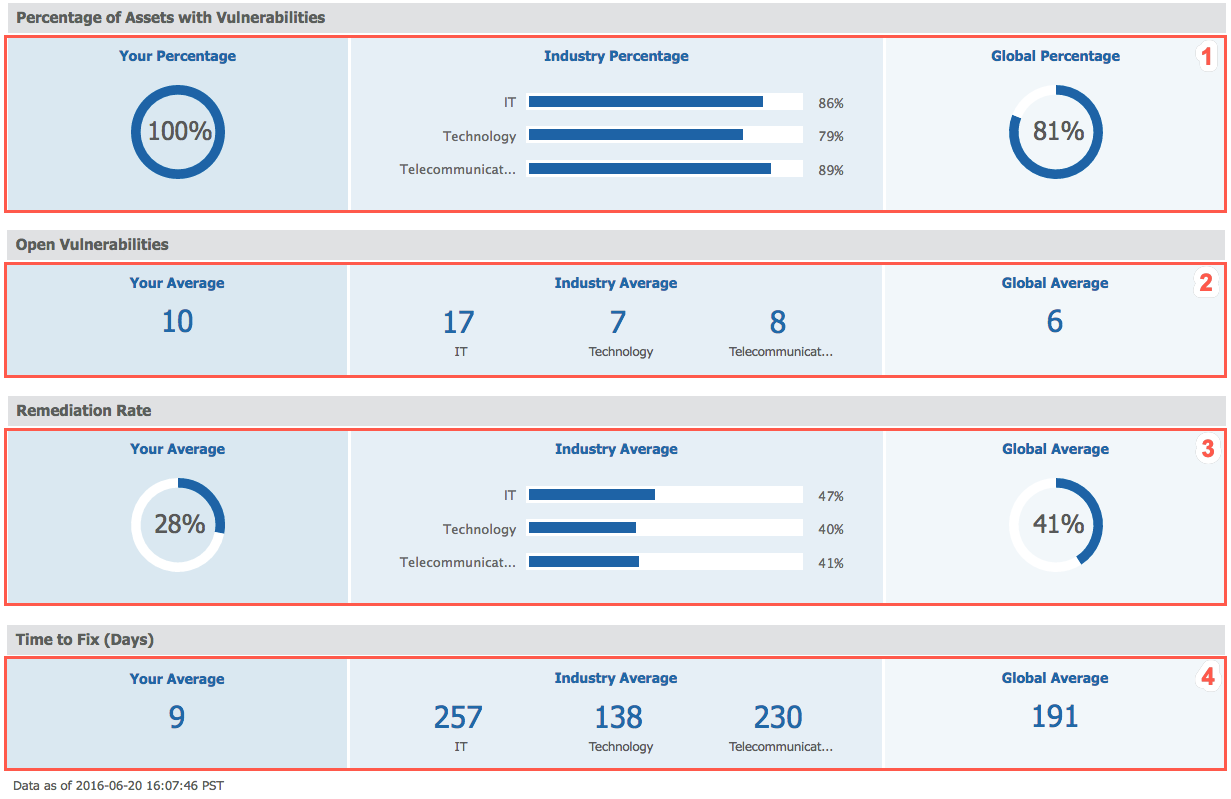
In the example given above, the customer has vulnerabilities in 100% of their assets. In the industries they’ve identified, the average percentage of assets with vulnerabilities is shown in bar charts: 86%, 79%, and 89% respectively for IT, Technology, and Telecommunications. Across all industries, 81% of assets have vulnerabilities of some sort. This suggests that an attacker may find this customer a fruitful target. |
2 |
Open Vulnerabilities |
In the example shown above, the customer has an average of 10 vulnerabilities per asset. In the industries they’ve identified, the average open vulnerabilities per asset is 17 (IT), 7 (Technology), and 8 (Telecommunications). Across all industries, the average vulnerability count per asset is 6. An attacker focusing on IT will be better served elsewhere, but an attacker focusing on Technology or Telecommunications may find this customer a fruitful target. |
3 |
Remediation Rate |
The vulnerability remediation rate is the ratio between vulnerabilities opened and vulnerabilities closed. In the example shown above, the customer currently has a remediation rate of 28%, whereas on an industry level the rates are 47% (IT), 40% (Technology), and 41% (Telecommunications). The global remediation rate is 41%. This suggests that the customer may need to focus on remediation in order to improve their security status. |
4 |
Time to Fix (Days) |
The average time to fix a vulnerability is the number of days between when a vulnerability was opened and when that vulnerability was closed. Shorter times to fix, particularly for significant vulnerabilities, make an asset more secure. Example: In the image displayed above, the customer’s average time to fix is nine days, which is much better than the industry or global numbers — 257 days for IT, 138 days for Technology, 230 days for Telecommunications, or 191 days on average across all industries. |