The Executive Dashboard
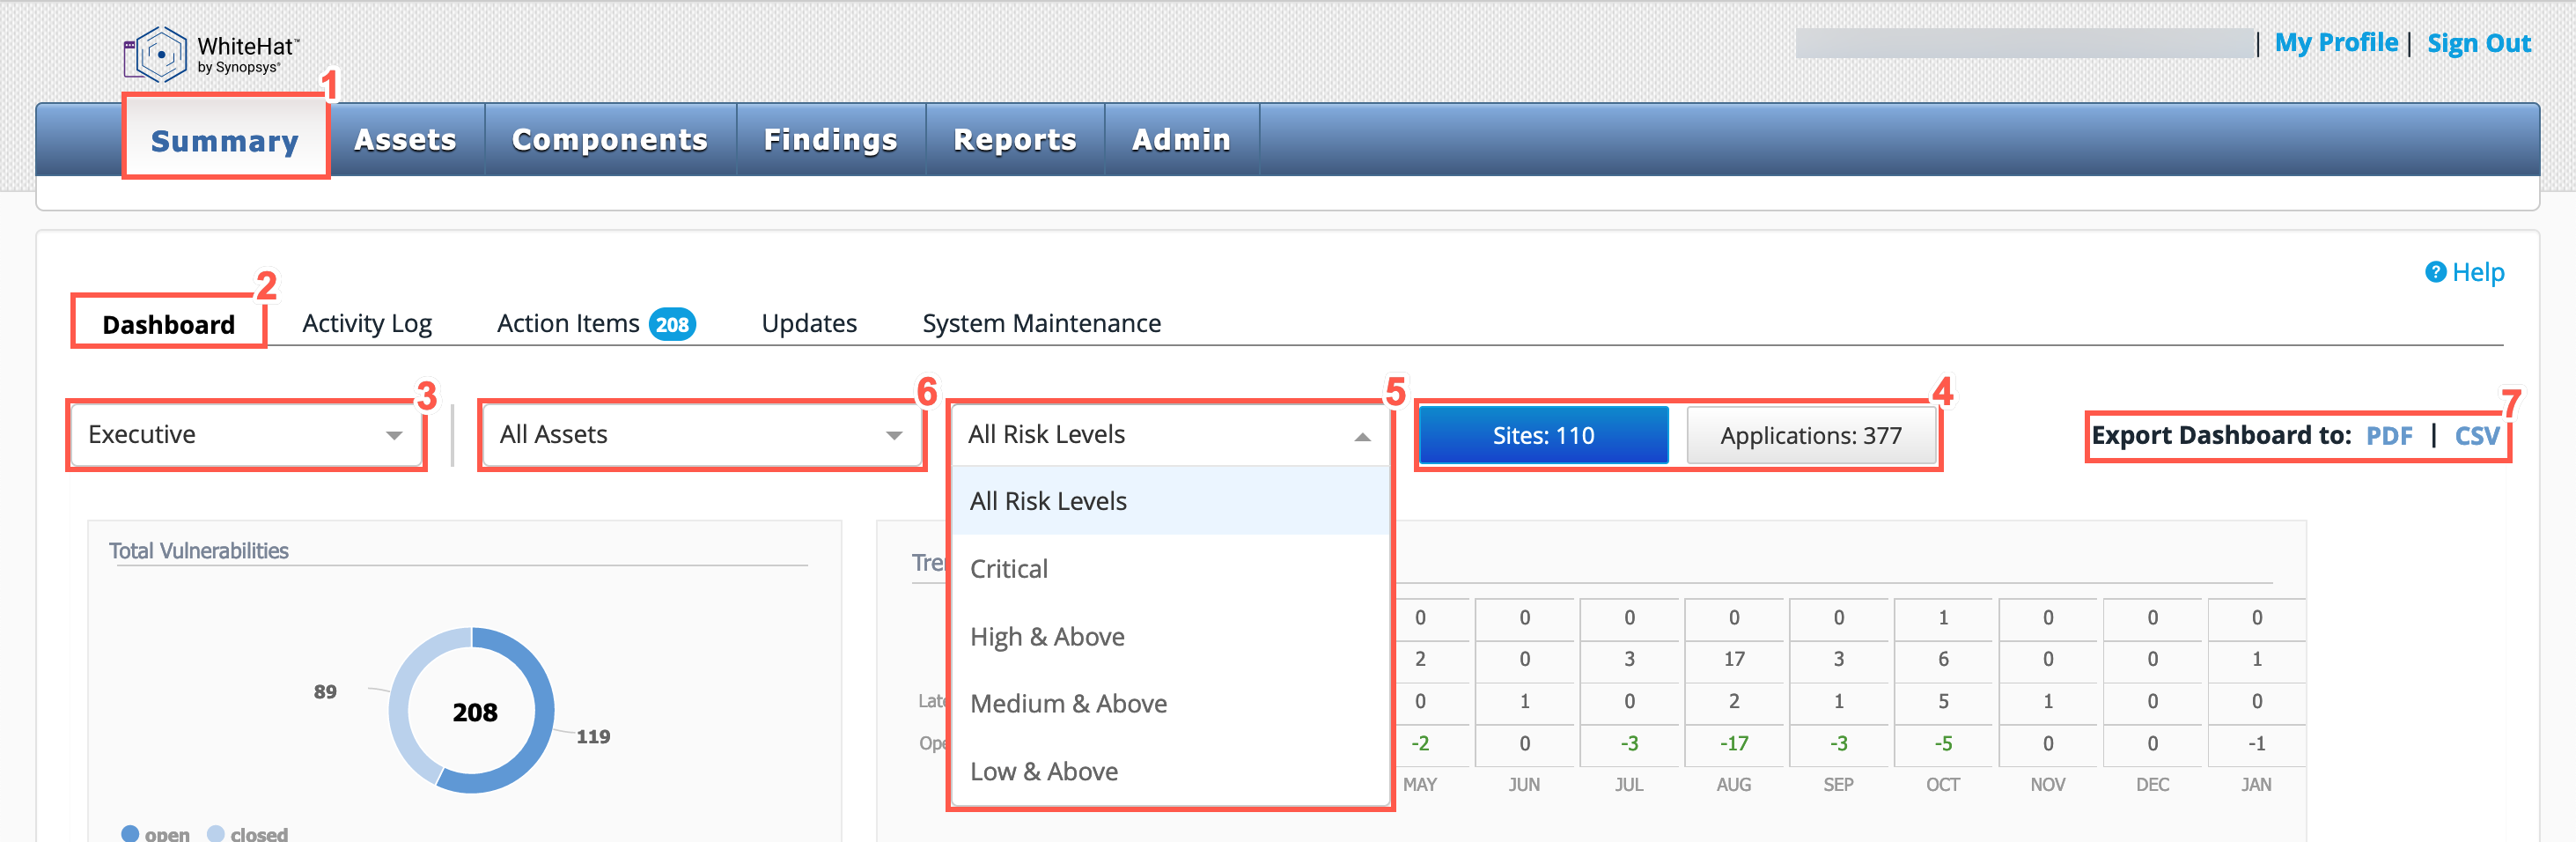
The Executive Dashboard provides reports and metrics with persistence of vulnerabilities and correlation with other assets and projects. This dashboard provides not just average remediation time, but many other analytics and trends to monitor and report on your overall security posture. To access this tab:
-
From the Continuous Dynamic Portal menu, select Summary.
-
From the tabs displayed, select the Dashboard tab.
-
From the dropdown list, choose Executive.
-
Select from the dropdown list which vulnerability Risk Level you want to display.
Selecting a Risk Level from the drop-down list will only filter the results on the Trend - Vulnerabilities and Vulnerability Statistics widgets. -
Select from the dropdown list a specific asset group or to display All Assets.
-
Optionally you can export the dashboards to PDF or CSV files.
Overview of Executive Dashboard
| Field No. | Field Name | Description | ||
|---|---|---|---|---|
1 |
Site Status |
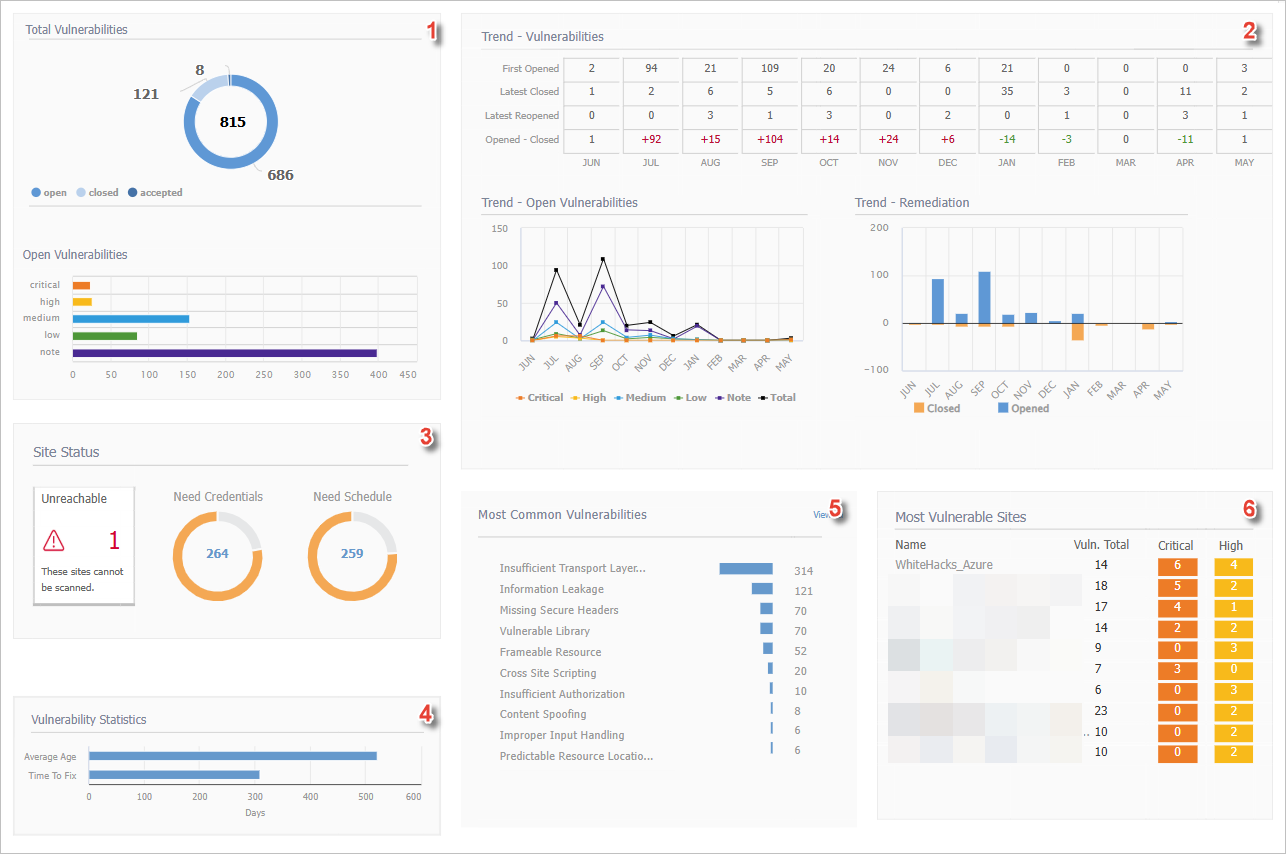
The Unreachable panel shows the total number of unreachable sites (those with a scan status of Access Issue: Site is unreachable). Alternatively, the panel displays a green check and the message "All sites are currently reachable". Inactive sites are excluded from the total. The Need Credentials and Need Schedule charts indicate how many sites require credentials to be added or a scan schedule to be set. In the example above, 265 sites need credentials and 264 require scan schedules.
|
||
2 |
Total Vulnerabilities |
This summarizes vulnerabilities currently open and closed over the lifetime of the asset. The following information is displayed:
|
||
3 |
Most Common Vulnerabilities |
This displays your most common vulnerability classes, sorted by the number of open vulnerabilities in that class. |
||
4 |
Most Vulnerable Sites |
This displays your most vulnerable sites. These are the sites with the greatest number of urgent or critical vulnerabilities, sorted by number size. |
||
5 |
Vulnerability Statistics |
Vulnerability Statistics show the average age of vulnerabilities by severity and the time it has been taking to remediate them. The average time to fix is the average of date closed minus date opened and only includes vulnerabilities that have a closed date. |
||
6 |
Licenses Available by Service Type |
This bar chart displays a count of your licenses for each DAST service level (BE, SE, and PE), divided into Used and Available licenses.
|
||
7 |
Trend - Vulnerabilities |
The Trend - Vulnerabilities table displays your closed vulnerabilities, new vulnerabilities, and total open vulnerabilities month-by-month. This will illustrate your improvement over time and will show up to twelve months of data.
EXAMPLE: In the table above, the month of August shows:
Below the Trend - Vulnerabilities table, you will see the Trend - Open Vulnerabilities line chart, which breaks out open vulnerabilities by severity. Also, you will see the Trend - Remediation bar chart showing vulnerabilities opened against vulnerabilities closed. |