Dashboard
The Dashboard tab gives you an easy-to-understand, comprehensive, and objective snapshot of your company’s security status and associated metrics. These aggregated results and statuses are presented as visual widgets that enable you to see what is going well, what needs improvement, and where action is required.
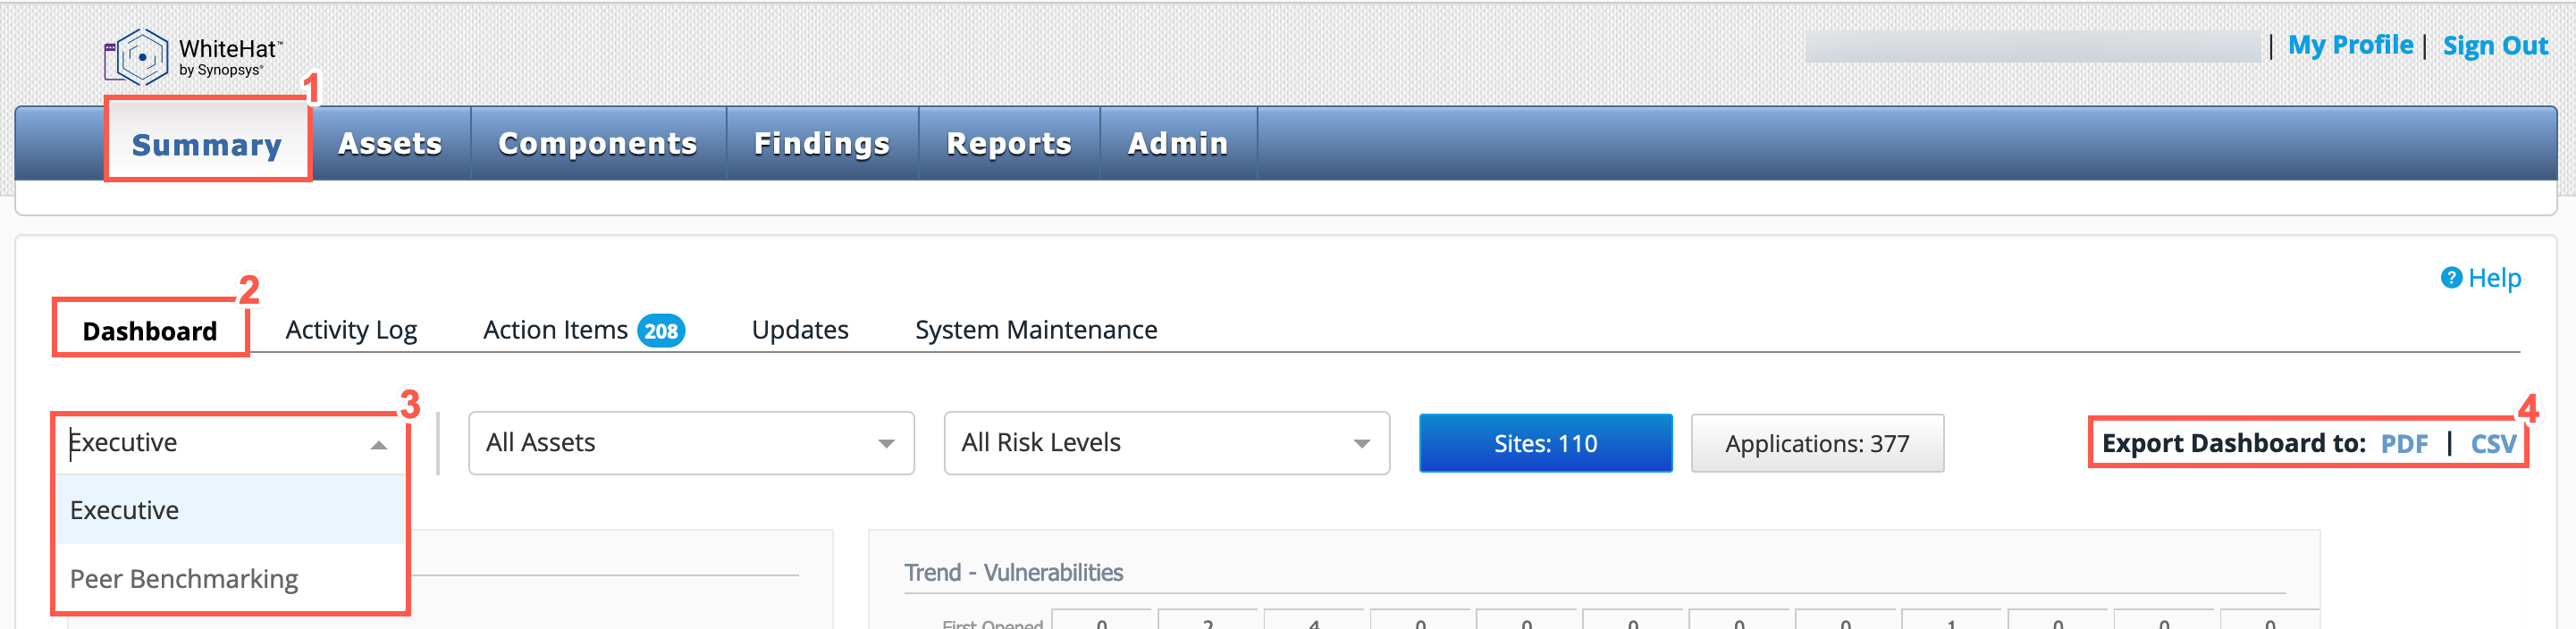
To access the dashboards:
-
From the Continuous Dynamic Portal menu, select Summary.
-
Select the Dashboard tab.
-
From the dropdown, select either the Executive or the Peer Benchmarking Dashboard.
-
(Optional) Filter the assets and vulnerability risk levels to include in the dashboard. To include all data, leave All Assets and All Risk Levels selected.
The Sites button shows the number of included site assets.
-
(Optional) You can export the dashboards to PDF or CSV files from here.
Dashboards Overview
The Executive Dashboard provides reports and metrics with persistence of vulnerabilities and correlation with other site assets and projects. This dashboard provides not just average remediation time, but many other analytics and trends to monitor and report on the overall security health for a complete application security footprint.
The Peer Benchmarking dashboard provides reports and metrics detailing risks from vulnerabilities and licenses, and also peer benchmark comparison with global industries.
See The Peer Benchmarking Dashboard.